The idea
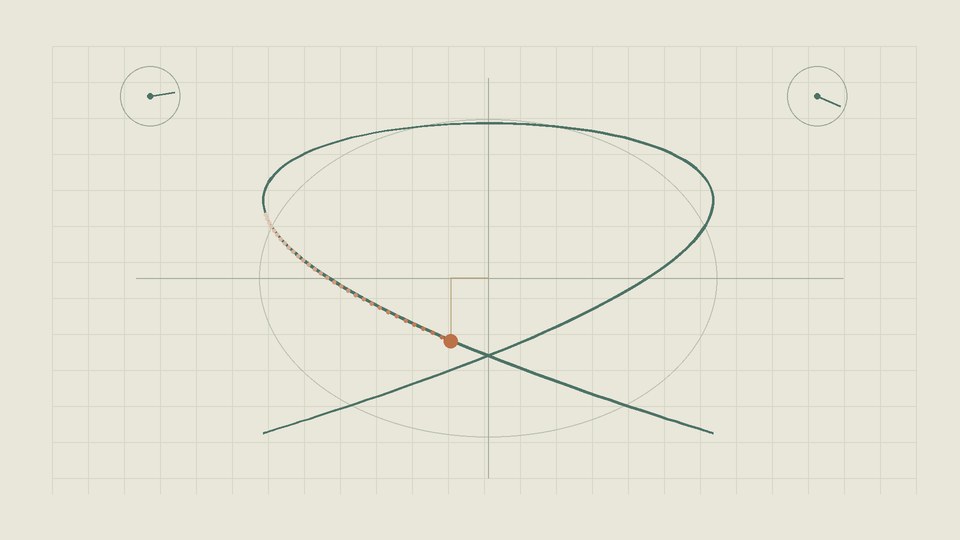
This animated drawing uses a Lissajous curve with a 3:2 frequency ratio. Horizontal and vertical coordinates come from two sine waves. The phase of one changes slowly, so the whole outline changes as well. There is no scientific measurement here: it is a visual geometric experiment.
Motion description
A dark green line forms intersecting loops on a pale square grid. Two small circular indicators with rotating pointers sit near the upper corners. An orange point follows the green outline, leaving a short dotted trail. Thin right-angled projections connect it to the axes. As the phase changes, the loops gradually change shape.
This description is a text alternative to the moving image. The film has no sound, speech or essential on-screen text.
What to notice
- Follow only the orange point first. Its trail shows the direction at a crossing.
- Then look at the two circular indicators: their pointers turn at different speeds.
- Finally take in the whole outline. It changes shape through a phase shift rather than simply rotating.
How it was made
The outline is calculated as x = a · sin(3u + φ), y = b · sin(2u). Phase φ increases with time, and the point travels along the current curve. The grid and projections help track the coordinates. This does not simulate a real instrument or an oscillating physical object.
Every frame was drawn procedurally, then the sequence was encoded as an MP4. No external photographs, fonts, footage or audio tracks are used.
Download and reuse
The film and poster are dedicated to the public domain under CC0 1.0. You may copy, trim, re-edit and use them without required attribution. Do not present the artwork as documentary footage.
693 169 bytes / 12 seconds / 24 fps / Silent. Licence.
- Origin
- Original procedural artwork for videolive
- SHA-256 / MP4
d146d2122157ba50af93510f9a2e894ea3a90395535527faf5808ea449fda6fb